If you click on the graph area, the day and apparent magnitude value for that location are displayed at the top.
The light variation of a Cepheid is shown over the course of many days. The irregularities in the light variation are due to observational errors.
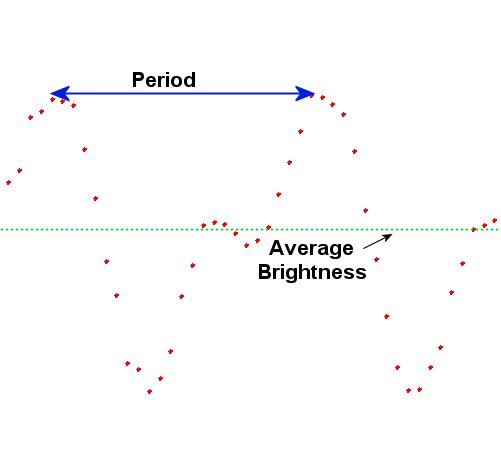
Below is a diagram showing a typical light curve, with the time span for a pulsation period shown and an estimate for the average magnitude.